The Russian economy is mixed: strategic areas are state-owned. Market reforms took place in the 1990s, as a result of which many industries were privatized. However, in the hands of the state remained the energy sector and the military-industrial complex. If we consider the indicator of Russia's GDP by years, it can be noted that the country belongs to the “above average” group. In addition, about 30% of the planet’s natural resources are concentrated in the country. According to World Bank estimates, their combined value is more than $ 75 trillion. A significant share in Russia's GDP is accounted for by income from sales of energy resources: oil and natural gas.
Overview
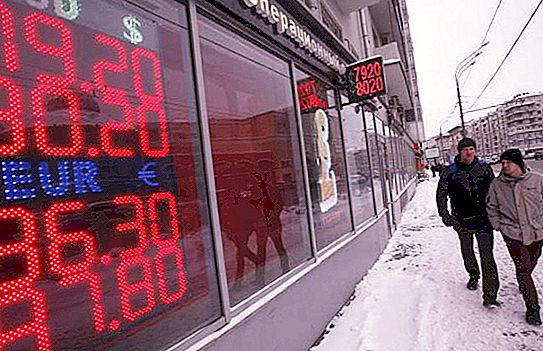
After the collapse of the USSR, all now former Soviet republics began to rebuild their economies, including Russia. However, important areas remained in the hands of the state, and the protection of private property rights was not established at the proper level. The Russian government has a significant impact on the economy. Today, Russia is a leading supplier of oil and natural gas, as well as an exporter of metals such as steel and aluminum. Therefore, the country is extremely dependent on world food prices.
Main characteristics
Gross domestic product (2017): nominal - 1.56 trillion US dollars, at purchasing power parity - 3.94. The average GDP growth in Russia over the years from 1996 to 2016 is 3.08%. The external debt of the country, according to December 2015, is 538 billion US dollars, gold and currency reserves for August 2016 - 396.4. The shadow economy, according to official estimates, is about 15% of GDP. Another 7% is not accounted for due to corruption. According to World Bank estimates, gross domestic product is one and a half times more due to the presence of the shadow economy.
Russian GDP dynamics
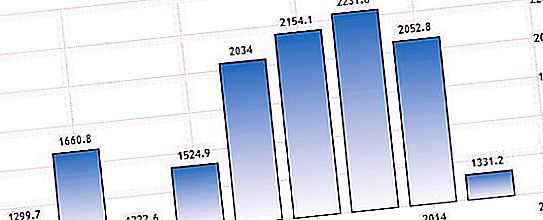
The gross domestic product of the Russian Federation today represents 2.15% of the world. Considering Russia's GDP over the years since independence, it can be noted that on average it amounts to 877.38 billion US dollars. Its minimum level was recorded in 1999, the maximum - in 2013. The average gross domestic product at purchasing power parity for this period amounted to $ 8621.41 billion.
| year | 2007 | 2008 | 2009 | 2010 | 2011 | 2012 | 2013 | 2014 | 2015 |
| billion dollars USA | 1300 | 1661 | 1223 | 1525 | 2034 | 2154 | 2232 | 2053 | 1331 |
In 2014, a recession began in Russia due to falling oil prices, Western sanctions and the subsequent outflow of capital. The growth was 0.6%. In 2015, GDP declined by 3.7%. It was expected that in 2016 this trend will continue. However, growth was 0.3%. According to forecasts of the World Bank and the IMF, in 2017 gross domestic product will continue to increase. If oil prices are at $ 40 per barrel, then we can expect it to fall by more than 5%.
Inequality of income distribution
In 2015, the Russian economy was sixth in terms of purchasing power parity and twelfth in terms of market exchange rates. If we consider Russia's GDP by years (in 2000-2012), it can be noted that living standards were increased due to the export of energy resources. Over this period, real disposable income grew by 160%, and in dollars - by 7 times. However, at the same time, the level of unemployment and poverty was almost halved, and the assessment of satisfaction with the life of Russians increased significantly. Such significant growth occurred against the backdrop of a commodity boom, high oil prices, and an effective economic and budgetary policy. However, incomes between residents of the country are distributed unevenly. It is estimated that 110 of the richest Russians own 35% of all financial assets. Inaction of the state in this area has led to the fact that Russia is in second place in terms of illegal cash outflows. It is estimated that between 2002 and 2011, it lost $ 880 billion.
Now nominal salaries have fallen below $ 450 per month. About 19.2 million Russians live below the poverty line. In 2015, they were 16% less. Revenues are distributed unevenly and geographically. Moscow is often called the billionaire city. The uneven distribution of incomes is largely due to the prevalence of corrupt practices and the weakness of legislative mechanisms. Transparency International ranked Russia 131st out of 176 in 2016.
Sectors of the economy
If we consider Russia's GDP over 10 years, we can note that its structure has not changed much. Today, agriculture accounts for about 5%, industry - more than 30%, and services - 60%. The number of economically active population is 76.9 million people. Of these, about 9% are employed in agriculture, 28% in industries, and 63% in services. The unemployment rate in 2016 amounted to 5.3%.