
When conducting an analysis of a company whose shares are traded on the market, it is extremely important to be able to quickly assess the ratio of the current market price of the paper in comparison with, relatively speaking, the success of this company. In other words, whether the stock is overvalued, fair, or underestimated. There is a whole range of financial ratios in the framework of fundamental analysis, allowing to carry out such an assessment.
Equity Liquidity Ratios
These data, including the P / E ratio, show and transform key information about the company, expressing it per share. These ratios make it possible to understand how much of the total revenue, profit, equity and dividends is calculated per one share of this company. This article focuses on one of these tools - the P / E ratio.
What does this mean?
The abbreviation P / E, which is also used in Russian-language sources, means literally “price to earnings”, that is, literally translated “price to profit”. Often a more familiar designation of this term in Russian is used - “multiple of profit”. The term P / E ratio is sometimes used to indicate the same meaning and is also used in the relevant literature.
How to calculate?
The formula for calculating the P / E coefficient is as follows:
Market Share Rate / Earnings per Share.
It is important to note here that profit does not mean the entire volume of the company's income, but net profit after all taxes and dividends on preferred shares are paid, per one share of this company.
That is, before calculating this ratio, an intermediate calculation of the earnings per share is required. This ratio is standardly denoted by the abbreviation EPS, which stands for "earnings per share", literally - "earnings per share". The formula for calculating it is very simple:
Earnings per share = (Net income after all taxes are paid - dividends on preferred shares) / Number of shares outstanding.
Typically, these indicators are calculated based on data obtained for one calendar year, and for analysis are considered in dynamics over a certain period of time. The initial data for such calculations can be obtained from the company's standard reporting materials published in the public domain.
For example, with the company's total net profit for the year of 5 billion rubles and the absence of dividend payments on preferred shares, 860, 000 outstanding shares in the market and the current market price of the shares of 120, 000 rubles, the P / E ratio can be calculated.
First we get EPS: 5.000.000.000/860.000 = 5.813.95 rubles.
Then the coefficient P / E = 120.000 / 5.813.95 = 20.6.
What does it mean?
The P / E coefficient shows how the stock market evaluates the company's stock at the moment. At its core, this coefficient expresses a simple fact - how many times the current market price of a share is more than the net profit generated by this one share. Or simply - how many annual profits are contained in the share price. One can give the following interpretation: over how many years the investment in this action will pay off if the affairs of this company will go in the same way as in the reporting year.

How can i apply?
By calculating this coefficient, the investor is able to assess the fairness of the share price in comparison with the profit generated by the company per share. If the ratio is of great importance, it is possible with a certain degree of certainty to conclude that the shares of this company are underestimated, and, having further studied its financial statements, make a decision on the acquisition of shares in anticipation of an increase in their value. Too low indicators can mean an inadequate assessment, the emergence of the so-called “bubble” in these shares, and signal the need to sell these shares before negative moments in the market occur.
The above reasoning is characteristic of the so-called effective stock market. However, often inexperienced investors act exactly the opposite, that is, focusing on high profitability, they acquire primarily shares of companies with low P / E ratios.
It should be noted that enterprises and companies of various industries have significantly different P / E levels. In slowly developing industries, such as pharmacology or shipbuilding, these indicators are significantly, often several times higher, than in dynamic industries such as the Internet industry, communications and several others. The capital intensity of the industry is also of great importance. Therefore, it is often pointless to compare this indicator for different companies. In order to increase the accuracy of the analysis, the P / E coefficient is calculated not only for the stocks of individual companies, but also for entire sectors of the national economy, which gives an additional opportunity to determine a kind of “advanced” in each industry with the appropriate basis for analysis. The “multiple profit” indicator is calculated similarly for stock indices, which are the average state of a stock market in a given country.

Mathematical interpretation
The calculation formula is the quotient of the division, where the share price is in the numerator and the share profitability in the denominator. Thus, if the numerator is stable, that is, the price of the stock does not increase, and the denominator, which reflects profitability, constantly increases, the coefficient falls. With such a development of events, it is obvious that this stock is underestimated by the market. The converse is also true. Therefore, when conducting an analysis, it is extremely important to study the behavior of the P / E coefficient in dynamics, which allows us to estimate and extrapolate the future price of a particular stock.

Household interpretation
In fact, this coefficient, for ease of understanding, can be arbitrarily described as the ratio of the current market price of the rented apartment to the annual rent for it. If the apartment costs 15 million rubles, and the annual rent is 720 thousand rubles, then the coefficient will be 20.8 (15.000 / 720). Which means that the cost of the apartment will fully pay off the cash flow from renting it out for 20.8 years.

Coefficient disadvantages
In addition to the industry differences already mentioned, the stock P / E ratio has a number of disadvantages. First of all, it must be borne in mind that one of the main indicators used to calculate it, namely, profit, can be subjected to some, however, completely legal manipulation. This can be done due to the fact that profit is the difference between revenue, the size of which is difficult to distort, and costs, the write-off and reflection of which in accounting are quite diverse. Underestimating profits in order to optimize taxes is a fairly common occurrence in all sectors and countries. A negative P / E coefficient occurs when a net loss appears in the reporting period instead of net profit. However, for new promising companies this is quite a common occurrence. In this case, analysis on this instrument is simply impossible, as it may lead the investor astray. The indicator is also ineffective in cases of early liquidation of the company, accompanied by the sale of assets and the closure of all debts of the company. However, the most important drawback of the P / E ratio is that it reflects the past, and all investors are primarily interested in the future. However, this disadvantage is inherent in all indicators, without exception.
Modified Ratio
There are several types of “multiple profit” ratios, so you need to be careful when analyzing them for different firms. The differences are mainly in the use of different profitability indicators. For calculation, the most commonly used profit is the company received for the last reporting fiscal year. However, often a predicted profit can be used instead, in which case the coefficient is called the “perspective P / E ratio, ” or forecast coefficient. The so-called “sliding” coefficient can also be applied, where quarterly company data is taken into account. The most “advanced” among the modified P / E ratios is CAPE (cyclically adjusted P / E ratio), or in Russian: “cyclically reduced ratio multiple of profit”. This coefficient is calculated on the basis of a 10-year moving average discounted at the inflation rate for this period. Its application allows you to “smooth out” the random jumps in the company's profit or the price of its shares in the market. The calculation is quite time-consuming, but there are appropriate calculators in the public domain.

Global stock market
Since almost every country has its own stock market, it is rather pointless to try to cover the vast, that is, cite the values of the P / E ratio of shares for individual companies, which number tens of millions. It is much more interesting to evaluate the P / E dynamics for stock exchange indices, which allow you to make certain forecasts regarding the possible directions of further market movements.
Below is a graph of the P / E coefficient for the S & P500, which is an integrated estimate of the 500 largest companies in retrospect.
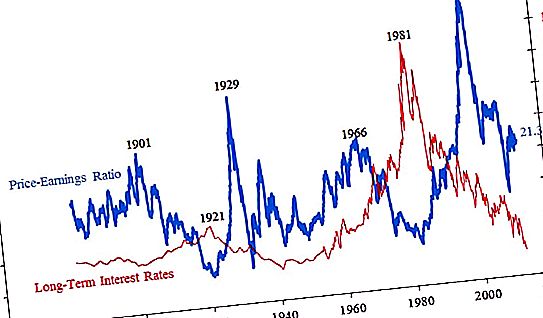
Extremely high values of the “multiple profit” indicator almost always lead to another financial crisis. Currently, the "average temperature in the hospital" is in the region of 20-21, which is quite high, but not critical. The graph also shows how much stock prices can sag after the bursting of “bubbles” in the market. If now and at the very beginning of the journey, that is, at the end of the 19th century, the indicator was in the region of 20, then during the Great Depression it reached 4, that is, the price of shares on average was equal to only four annual profits of companies. At the peak of stock bubbles, stock prices soared on average up to 45 annual earnings per share. It is noticeable that over time, the market later began to respond to inadequate increases in stock prices. At the beginning of the century before last, the recession began at a P / E coefficient of 26, later at 34, and most recently only at 45.
Russian companies
P / E ratios of Russian stocks can be found in the following table:
| Company name | Capital billion rubles |
Coefficient value P / e |
| Rosneft | 4871 | 21.9 |
| LUKOIL | 4236 | 10.6 |
| Gazprom | 3639 | 5.1 |
| NOVATEK | 3280 | 20.9 |
| Gazpromneft | 1835 | 7.3 |
| Nornickel | 1815 | 14.2 |
| Severstal | 872 | 8.6 |
| Yandex | 659 | 42.9 |
| AFC System | 78 | 19.0 |
| Aeroflot | 113 | 4.9 |
| KamAZ | 41 | 12, 2 |
| M Video | 73 | 10.5 |
As can be seen from the above data, we can conclude that a significant number of Russian companies are underestimated. P / E coefficients differ significantly depending on the industry in which a company operates, and are somewhat underestimated in relation to the current global level of P / E values in the region of 20.
The main Russian companies
Today, the largest capitalization in Russia boasts two companies. This is Gazprom joint stock company and the number one bank in our country - Sberbank. On the Moscow stock exchanges, the turnover on the shares of these two companies is more than half of the total turnover of trading floors. P / E ratio of Sberbank with total capitalization, according to the latest annual reporting data of 4.2 trillion rubles, is 5.8. Relatively speaking, investments in shares of this bank pay off in 5.8 years. At the end of 2018, after a serious drop in prices, this asset has a coefficient of around 8, which is still a fairly low indicator. Other banks, which differ by several times from Sberbank, have higher values. For example, Vneshtorgbank - 8.2, and Rosbank - 9.2. Gazprom's P / E ratio, until recently the former number one on the Russian stock market, is currently 5.1. This is also a fairly low indicator, especially in comparison with other companies in this industry. Rosneft and NOVATEK have coefficient values over 20, and LUKOIL over 10.


